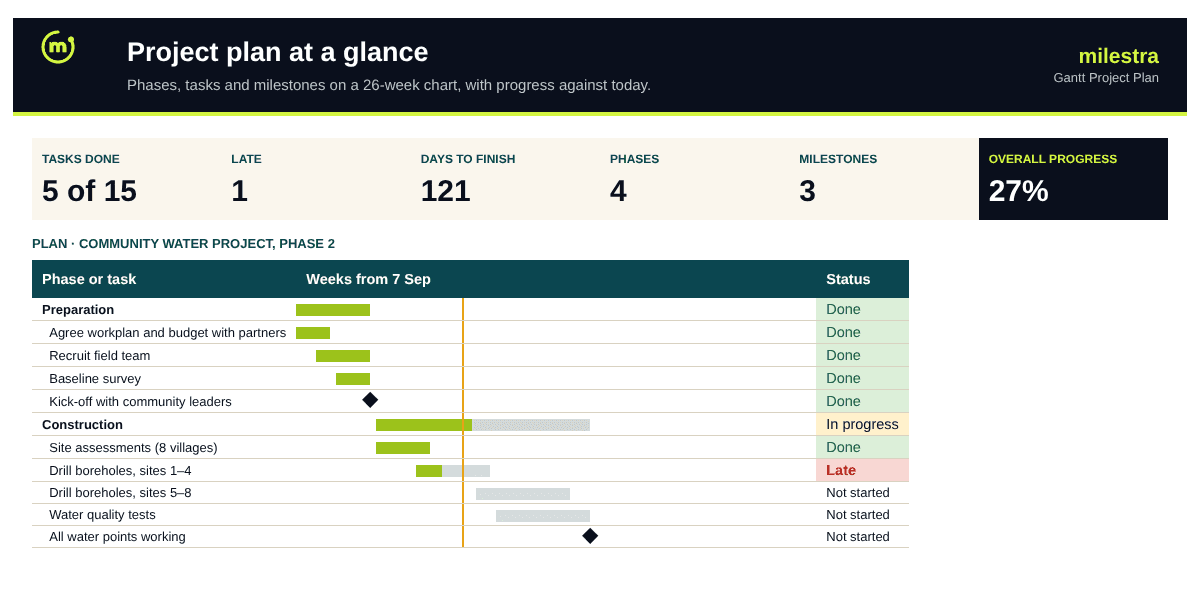
Free Gantt project plan: phases, tasks and milestones on a chart that draws itself
Most project plans are either a list nobody can picture or a chart nobody updates. This one is both in one sheet: type each task's dates and % complete, and the 26-week Gantt chart, the late flags and the dashboard update by themselves.
Excel · 3 sheets
Gantt project plan
Phases, tasks and milestones on a 26-week Gantt chart, with late flags and a one-page project summary.
26-week Gantt chart drawn from your dates
Progress shaded inside each bar
Milestones and today's week marked
Late tasks listed on the dashboard
Free · Opens in Excel and Google Sheets · Sent to your inbox
What's inside
Sheet
What it does
Dashboard
Overall progress, tasks done, late tasks and days to finish; every phase's progress and status; the next milestones.
Plan
WBS number, phase or task, owner, start, end, % complete and milestone flag, with days, status and the 26-week chart calculated.
Start here
How to set up the project name, the chart's first week and your phases.
How to use it well
Set the project and the first week. Type the project name and a Monday in the lime cells at the top of Plan. The chart starts from that week.
Number phases 1, 2, 3 and tasks 1.1, 1.2. Whole numbers are phases and show in dark bars; tasks under them show in teal.
Give every task an owner and an end date. A task without both can't be late, so it never gets attention.
Mark milestones. Set Milestone to Yes on the moments that matter: approvals, handovers, launches. They appear as diamonds and on the dashboard.
Update % complete each week. The done share of each bar fills in lime, and tasks behind their end date are flagged Late.
Move the chart forward. When the project runs past 26 weeks, change the first week. Nothing else needs to move.
Skip the spreadsheet
Link every task to the goal it serves
In Milestra, projects sit under the goals they deliver. Owners get reminders before tasks slip, progress rolls up to your dashboard, and funders see results rather than a chart. Free for up to 5 people, and nonprofits get 50% off paid plans.
When its end date has passed and it is under 100% complete, or when it is more than 20 percentage points behind where its dates say it should be by today. Late tasks show in red and on the dashboard.
How is overall progress worked out?+
Each task's % complete is weighted by its length in days, so a six-week task counts more than a two-day one. Phases are left out so nothing is counted twice.
Can I show more than 26 weeks?+
The chart shows 26 weeks from the start week you choose. Change the start week to move along a longer project; the dates and progress stay where they are.
How many tasks can it hold?+
150 rows of phases and tasks, which suits most single projects. For a portfolio, use one file per project or the multi-project action tracker.
Do I need to draw the bars?+
No. The bars are conditional formatting driven by your dates, so they redraw as soon as a date changes.
Does it work in Google Sheets?+
Yes. Upload the .xlsx file to Google Drive and open it with Google Sheets. Formulas, dropdowns, colours and progress bars carry over. It also works in Excel 2019 or later and Microsoft 365.
Is it really free?+
Yes. Enter your email and we send the file straight to your inbox. Use it and share it inside your organisation as often as you like.