Free donor report template and format for nonprofits (Excel)
A donor report should take hours, not days. This free Excel template turns your indicators into a report funders can trust: results against targets, evidence, cost per result and a clear narrative, ready for your board, foundations and institutional donors.
Excel · 5 sheets
Quarterly donor report template
Results, evidence and cost per result in one place, ready for your board and funders.
% of target and status calculated for every indicator
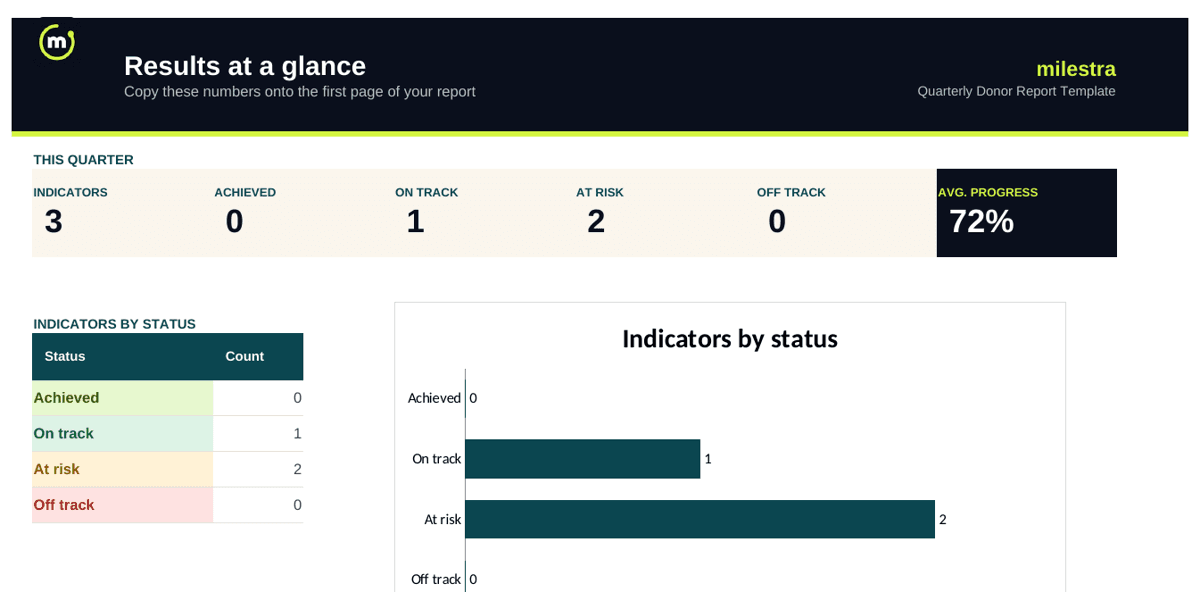
One-page summary dashboard with a status chart
Cost per result for each budget line
Six prompts that write the narrative with you
Free · Opens in Excel and Google Sheets · Sent to your inbox
What's inside the template
Sheet
What it does
Start here
Four steps to fill it in and a colour key for the cells you type in.
Results
Goal, indicator, unit, baseline, target and actual. % of target, status and a progress bar fill in automatically.
Summary
A one-page dashboard: how many indicators are achieved, on track, at risk or off track, plus a chart.
Budget vs results
Budget, spend, % spent and cost per result for each budget line.
Narrative
Six prompts that help you write the story: headline, progress, challenges, evidence, learning and next quarter.
How to write a donor report in six steps
Lead with one result. “1,240 more learners now read at grade level” beats a paragraph of activities.
Report every agreed indicator. Baseline, target and actual, in the same order as your logframe or results framework.
Show the evidence. Name the source for each key number: assessments, registers, surveys or photos.
Connect money to results. Spend against budget, and the cost of each result where you can.
Be honest about what slipped. Funders trust a report that names what is off track and what you are doing about it.
Close with what comes next. Three goals for the next period, each with a target.
Example results table
Indicator
Baseline
Target
Actual
% of target
Status
Learners reading at grade level
38%
55%
49%
65%
At risk
Teachers completing the full course
0
600
540
90%
On track
Schools submitting data on time
120
200
168
60%
At risk
When a spreadsheet isn't enough
Spreadsheets work until several people update the same file, evidence lives in email, and the quarter ends in a scramble. Milestra keeps goals, indicators, weekly check-ins and evidence in one place, so the same report builds itself from live numbers. It's free for up to 5 people, and nonprofits get 50% off paid plans.
Frequently asked questions
What should a donor report include?+
A headline result with one number, your results against the targets you agreed with the funder, the evidence behind the key numbers, how the budget was spent and what each result cost, what is off track and your plan, and your goals for the next period. The template has a sheet for each.
What is the standard donor report format?+
Most funders expect the same order: a short summary with the headline result, a results table showing baseline, target and actual for each indicator, what the money was spent on against the budget, one or two stories or pieces of evidence, challenges and what you changed, and plans for the next period. If your funder supplies its own format, use theirs and keep this structure for your own records.
How often should a nonprofit send donor reports?+
Follow your grant agreement first. Most institutional funders ask for quarterly or six-monthly reports plus an annual report; individual major donors usually value a short update every quarter.
How is % of target calculated?+
% of target = (actual − baseline) ÷ (target − baseline). If reading levels started at 38%, the target is 55% and you are at 49%, you have achieved 65% of the planned improvement.
What is the difference between outputs and outcomes?+
Outputs are what you delivered, such as 600 teachers trained. Outcomes are what changed because of it, such as more learners reading at grade level. Funders increasingly pay for outcomes, so report both.
Does the template work in Google Sheets?+
Yes. Upload the .xlsx file to Google Drive and open it with Google Sheets. The formulas, status colours and progress bars carry over.
Is it really free?+
Yes. Enter your email and we send it straight to your inbox. You can share it with your team and partners.